2-04: Which Statements
0.1 To-do
1 Purpose
create conditional statements to evaluate the values in a vector
get the index of vector values that meet a condition
use indexing to subset another vector
plot values from a subset index
2 Script and data for this lesson
The script for this lesson can be downloaded here
The data for this lesson can be download here
3 which() – conditional statements for vectors
which() answers the question: Which values in this vector meet a specified condition?
The answer to which() is presented as a vector of index values representing the values in the vector where the condition is TRUE.
Let’s do some quick example with the following vectors:
ages = c(25,47,13,59,76,33,45);
animalNames = c("llama", "alpaca", "goat", "llama", "guanaco");
We will ask four questions, using which(), on the two vectors above:
Which ages are greater than 40?
Which ages are less than or equal to 33?
Which animalsNames are equal to llama?
Which animalsNames are not equal to llama?
index1 = which(ages > 40);   # index of ages greater than 40
index2 = which(ages <= 33);  # index of ages less than or equal to 33
index3 = which(animalNames == "llama"); # index of animals named "llama"
index4 = which(animalNames != "llama"); # index of animals not named "llama"
which() outputs a vector of indexed values that meet the condition in parentheses. This vector is saved to the variables index1, index2, index3, and index4.
3.1 which() produces an index vector
The four index vectors contain the index of the values that met the condition – not the values itself.
The number of values in the vector that met the condition is given by the second number in brackets [1:X]. The second number is also the length of the vector.
index1: int [1:4] 2 4 5 7
index2: int [1:3] 1 3 6
index3: int [1:2] 1 4
index4: int [1:3] 2 3 5
index1 says there were 4 values in ages greater than 40: values 2, 4, 5, and 7 (values: 47, 59, 76, and 45)
index2 says there were 3 values in ages less than or equal to 33: values 1, 3, and 6 (values: 25, 13, and 33)
index3 says there were 2 values in animalNames that were equalto “llama”: values 1 and 4
index4 says there were 3 values in animalNames not equal to “llama”: values 2,3 and 5 (alpaca, guanaco, and goat)
4 Using which() on numeric data
For the rest of this lesson, we are going to use the weatherData frame from last lesson.
weatherData = read.csv(file="data/Lansing2016NOAA-3.csv");We are going to use which() to
find values in the precipitation columns that meet a certain condition
subset other columns (e.g., avgTemp, relHum) by these values
- in other words, find the avgTemp on days where precipitation meets a certain condition
4.1 Finding the NA values using which()
In the last lesson we took the chr column precip, converted it to a numeric vector, and then using for loops, changed the NA values to 0.005.
We are going to repeat this process using which() statements.
First we will save the precip column in weatherData to the vector precip:
precip = weatherData$precip;Then convert the chr vector precip to a numeric vector – and save the results to precip2:
precip2 = as.numeric(precip);Use which() to find which values in precip2 are NA:
naValues = which(is.na(precip2));In the Environment, we see there are 60 NA values in precip2, starting with values 3, 4, 14… (meaning the 3rd, 4th, 14th… values in precip2 are NA)
naValues: int[1:60] 3 4 14 16 17 19 20 ...Create a copy of precip2 called precip3 (this is only done so we can see the progress):
precip3 = precip2;Set the precip3 values indexed by naValues to 0.005 (change the 3rd, 4th, 14th… values in precip2 to 0.005):
precip3[naValues] = 0.005;Like last lesson, we see the progress from a chr vector (precip) to a numeric vector with NA values (precip2) to a numeric value with NA values replaced with 0.005 (precip3):
precip:   chr[1:366]  "0.04" "0.00" «"T"» «"T"» "0.00" ...
precip2:  num[1:366]  0.04 0 «NA» «NA» 0 ...
precip3:  num[1:366]  0.04 0 «0.005» «0.005» 0 ...
4.2 Subset based on numeric conditions
We are going to subset the precipNum column in 3 ways:
no precipitation (precipitation == 0.00)
a lot of precipitation (precipitation > 1.00).
moderate precipitation (precipitation between 0.25 & 0.50).
First we need to create vectors that contain the index values for precipNum that correspond to the three scenarios above. We will use which() on the precipNum column. which() statements use conditional statement just like if statements.
daysNoPrecip = which(weatherData$precipNum == 0.00);   # days where precip is 0
daysHighPrecip = which(weatherData$precipNum > 1.00);  # days where precip is > 1
Note: it is good practice to put in the decimal (1.00 as opposed to 1) to indicate to the reader that it is a real number that, in this situation, happens to have a value the looks like an integer.
The first two scenarios have one condition, the third scenario has two conditions:
precipNum > 0.25 and
precipNum < 0.50
As with if statements, when you have multiple condition, each condition must be explicit:
# explicit condition: days where precip is > 0.25 and precip < 0.5
daysModPrecip = which(weatherData$precipNum > 0.25 & weatherData$precipNum < 0.5);

# this code is not explicit and will cause an error
# daysModPrecip = which(weatherData$precipNum > 0.25 & < 0.5);
We see in the Environment tab that there were:
167 days without any precipitation
8 days with precipitation more than 1 inch
18 days with precipitation between 0.25 and 0.50 inches
daysHighPrecip: int [1:«8»]  73 91 225 228 229 273 290 307
daysModPrecip:  int [1:«18»]  33 88 119 121 123 125 168 183 ...
daysNoPrecip: int [1:«167»] 2 5 6 7 24 30 37 38 42 49 ...5 Subsetting other vectors
The index vectors in Figure 1 give the rows in weatherData$precipNum that meet the given condition. We can use this information to subset other columns and answer questions like:
Which dates (dateYear column) had more than 1 inch of rain?
What was the average wind speed (windSpeed) for the days that had greater than 1 inch of rain?
rainyDates = weatherData$dateYear[highPrecipIndex];
rainyDayWindSpeed = weatherData$windSpeed[highPrecipIndex];
rainyDates and rainyDayWindSpeed are both vector with 8 values, the 8 values are on the rows where the precipitations are greater than 1 inch.
We see in the Console the 8 dates that had a high amount of precipitation and the average wind speed for those dates:
> rainyDates
[1] "03-13-2016" "03-31-2016" "08-12-2016" "08-15-2016" "08-16-2016" "09-29-2016" "10-16-2016"
[8] "11-02-2016"
> rainyDayWindSpeed
[1] 9.2 17.3 6.1 3.8 9.2 12.4 8.1 4.66 Plotting subsetted vectors
In previous lesson, we created a scatterplot by initializing a data frame in ggplot() and mapping columns to the x and y axes:
plot1 = ggplot(«data=weatherData») +                # initialize data frame
  geom_point( «mapping=aes(x=avgTemp, y=relHum)»,   # map the x and y axes
              color = "blue") +
  labs( title="Humidity vs. Temperature",
        subtitle="Lansing, 2016",
        x = "Temperature (F)",
        y = "Humidity (%)") +
  theme_bw();
plot(plot1);
And we get a scatterplot of all 366 values:
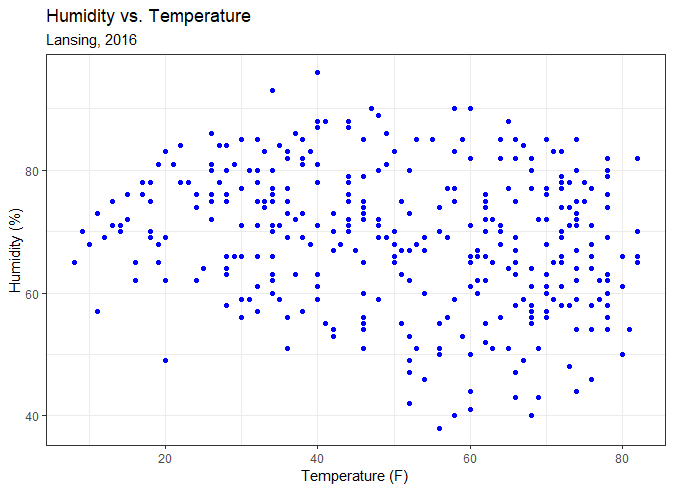
In this section, we want to create a humidity (relHum) vs temperature (avgTemp) scatterplot limited to the days that meet the precipitation conditions.
In GGPlot there are two ways to do this:
subset the weatherData data frame
subset the x and y mappings
6.1 Subsetting the data frame
When we use this code to set up a ggplot canvas:
ggplot(data = weatherData)We are saying that the plots added to the canvas are going to use data from the weatherData data frame.
In this case, we do not want to use all of the rows from the data frame – so, we want to set up the ggplot canvas with a data frame that is a subset of weatherData
We can create a subset of weatherData using the index vector daysHighPrecip. In other words, we create a data frame that only has the rows from weatherData given by daysHighPrecip.
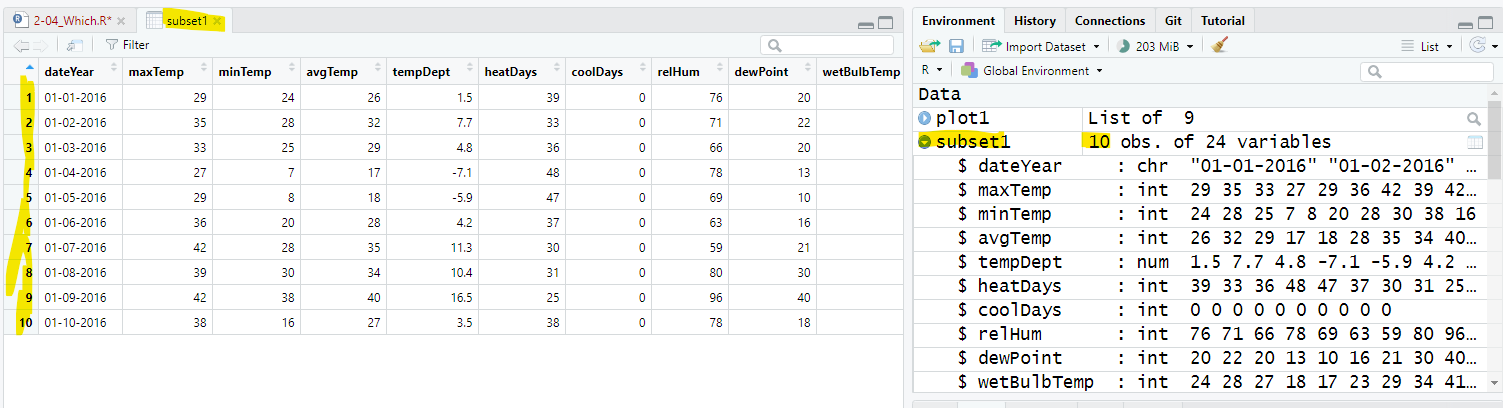
To subset rows in a data frame:
subset1 = weatherData[1:10,]; # subset rows 1-10, all columns
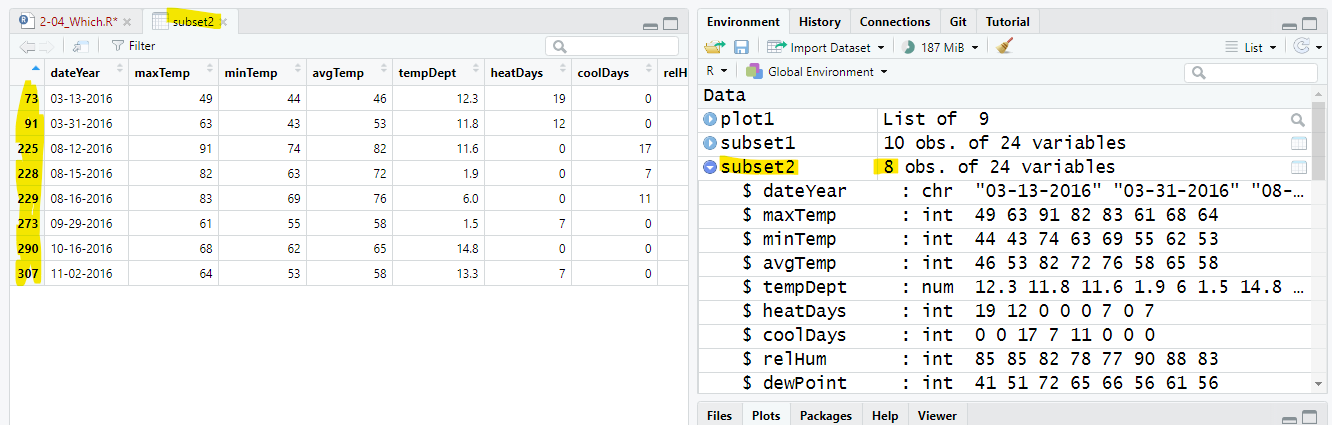
subset2 = weatherData[daysHighPrecip,] # subset rows given by daysHighPrecipsubset1 has the first 10 rows of weatherData:
subset2 is 8 rows from weatherData given by the 8 index values in daysHighPrecip (73, 91, 225..).
6.2 Using a subset dataframe in ggplot
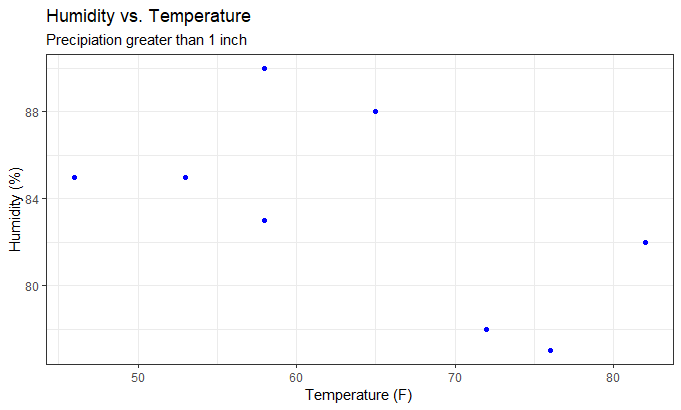
To plot the data from the 8 rows with precipitation greater than one inch, we can initialize ggplot() with the subsetted data frame, subset2.
plot2 = ggplot(data=«subset2») +      # initialize the canvas with subset2
  geom_point( mapping=aes(x=«avgTemp», y=«relHum»), # avgTemp and relHum from subset2
              color = "blue") +
  labs( title="Humidity vs. Temperature",
        subtitle="Precipiation greater than 1 inch",
        x = "Temperature (F)",
        y = "Humidity (%)") +
  theme_bw();
plot(plot2);
Since the subsetted data frame only has 8 rows, the plot will have only 8 points representing the 8 days of high precipitation:
6.3 Subset the mappings
The second way to plot the data is to:
not initialize the ggplot canvas area with a data frame (use ggplot() without data)
directly map the subset vectors – in this case, avgTemp and relHum.
If we subset relHum and avgTemp with the daysHighPrecip vector, then we get the 8 humidity and temperatures values that correspond to the 8 days with high precipitation:
> weatherData$relHum[daysHighPrecip]
[1] 85 85 82 78 77 90 88 83
> weatherData$avgTemp[daysHighPrecip]
[1] 46 53 82 72 76 58 65 58
We can map the data inside the component geom_point() instead of the initializing the canvas with a dataframe inside ggplot():
plot3 = ggplot() +    «# no data frame was initialized for the ggplot canvas»
  geom_point( mapping=aes(«x=weatherData$avgTemp[daysHighPrecip]»,
                          «y=weatherData$relHum[daysHighPrecip]»)) +
  labs( title="Humidity vs. Temperature",
        subtitle="Precipitation greater than 1 inch",
        x = "Temperature (F)",
        y = "Humidity (%)") +
  theme_bw();
plot(plot3);
This code will produce the exact same plot as above (Figure 6).
Warning: You will get an error if you mix the two method (initializing the canvas with a data frame and mapping subsetted vector).
6.4 Manually entering values in mappings
When you do not initialize a data frame in ggplot(), then you have manually enter vectors in the mappings. To be explicit about this fact, we could just put in vector values:
plot4 = ggplot() +
  geom_point( mapping=aes(x=c(46,53,82,72,76,58,65,58),
                          y=c(85,85,82,78,77,90,88,83)),
              color = "blue") +
  labs( title="Humidity vs. Temperature",
        subtitle="Precipiation greater than 1 inch",
        x = "Temperature (F)",
        y = "Humidity (%)") +
  theme_bw();
plot(plot4);
This code will, again, produce the exact same plot as above (Figure 6).
7 Application
- Find dates that had snow (so, snow > 0)
- snow, like precip, uses T values
- Find dates that had more than a trace of rain
- Find the dates that had peak winds between 30 and 40 mph
- Create a rain vs temperature scatterplot for these date
Find the number of days the humidity was high (greater than 85%) and for these days output to the Console:
the date
the amount of precipitation
the maximum wind speed
The results of #4 would be best done with a for loop the cycles through all the days and should look something like this:
01-09-2016 had X inches of rain and a wind speed of X miles/hour
01-14-2016 had X inches of rain and a wind speed of X miles/hour
01-15-2016 had X inches of rain and a wind speed of X miles/hour
Save the script as app2-04.r in your scripts folder and email your Project Folder to Charlie Belinsky at belinsky@msu.edu.
Instructions for zipping the Project Folder are here.
If you have any questions regarding this application, feel free to email them to Charlie Belinsky at belinsky@msu.edu.
7.1 Questions to answer
Answer the following in comments inside your application script:
What was your level of comfort with the lesson/application?
What areas of the lesson/application confused or still confuses you?
What are some things you would like to know more about that is related to, but not covered in, this lesson?
8 Extension: Subset using dataframe columns
The line of code:
humidity = weatherData[,"relHum"];saves all the values from the column relHum in the data frame weatherData to the vector humidity.
We then could use humidity to find which days had high humidity
highHumidity = which(humidity > 80); # days with high humidityBut we could also directly use the relHum column from the data frame
highHumidity = which(weatherData[,"relHum"] > 80);While we can use both humidity and weatherData[,"relHum"] in the which(), the former is preferred because it is easier to read.
9 Extension: The TRUE/FALSE vector
Let’s take another look at the which() code:
ages = c(25,47,13,59,76,33,45);
animals = c("llama", "alpaca", "goat", "llama", "guanaco");

index1 = which(ages > 40);   # index of ages greater than 40
index2 = which(ages <= 33);  # index of ages less than or equal to 33
index3 = which(animalNames == "llama"); # index of animals named "llama"
index4 = which(animalNames != "llama"); # index of animals not named "llama"
There is an in between step that we skipped over here. Each which() has a conditional statement inside. That conditional statement gets evaluated by R first, and then which() is performed on the answer to the conditional statement. Using the Console, let’s look at how the conditional statements inside the which() get evaluated by R:
> ages > 40
[1] FALSE  TRUE FALSE  TRUE  TRUE FALSE  TRUE
> ages <= 33
[1]  TRUE FALSE  TRUE FALSE FALSE  TRUE FALSE
> animalNames == "llama"
[1]  TRUE FALSE FALSE  TRUE FALSE
> animalNames != "llama"
[1] FALSE  TRUE  TRUE FALSE  TRUE
Each conditional statement above produces a vector that has the same length as the number of values in the vector (ages and animalNames). The vector produced has only two vales: TRUE and FALSE. The TRUE and FALSE values match the index of the values in the original index.
So if:
ages = c(25,47,13,59,76,33,45);then:
(ages > 40) is evaluated as: c(FALSE, TRUE, FALSE, TRUE, TRUE, FALSE, TRUE)
This indicates that the 2nd, 4th, 5th, and 7th values of the vector ages are greater than 40
which() takes the TRUE/FALSE vector and outputs the indices of the TRUE values
which(ages > 4); # This evaluates to c(2, 4, 5, 7)