2-13: Breakpoints
0.1 To-do
- mention that you sometimes need to clear all breakpoints in RStudio (an RStudio bug)
1 Purpose
set up breakpoints
pausing execution of script for debugging
use breakpoints inside for loops
set up a conditional breakpoint
2 Material
The script for the lesson is here
A second script that contains a function to debug
The data used for the lesson is here
3 Debugging your code
One of the most powerful debugging tools in any programming language, and a staple of most professional programmers, is the breakpoint. Breakpoints allows you to pause the execution of your script at a specific line or command. While paused, you can look at the Environment, enter commands in the Console, or move through your script one command at a time. This is a very useful tool when debugging for loop that cycles thousands of times.
The implementation of breakpoints in R is far less robust than most programming languages. Even with R’s limitations, breakpoints are still a useful debugging tool in R.
4 Setting up a breakpoint
A breakpoint is like a pause button in the execution your script. There are multiple ways to set a breakpoint. In this lesson we will focus on using the Rstudio interface to set a breakpoint. In RStudio, you set a breakpoint by clicking to the left of the line number – this space is called the gutter area. A red dot representing the breakpoint appears in the gutter area. Clicking again will get rid of the breakpoint.
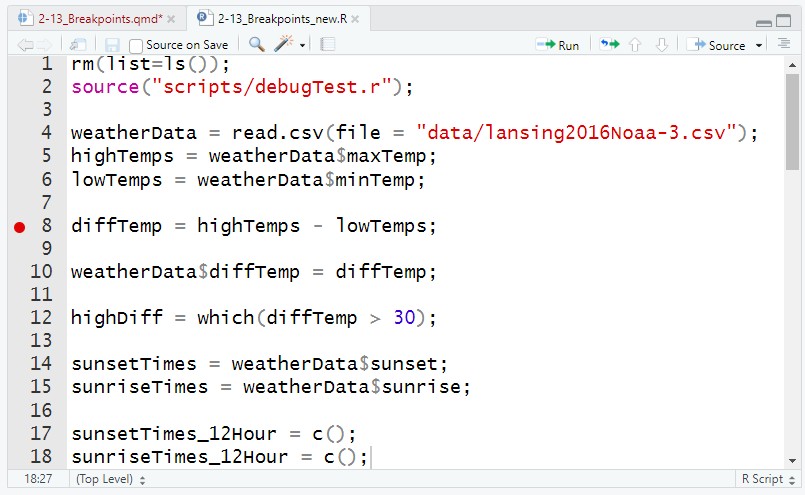
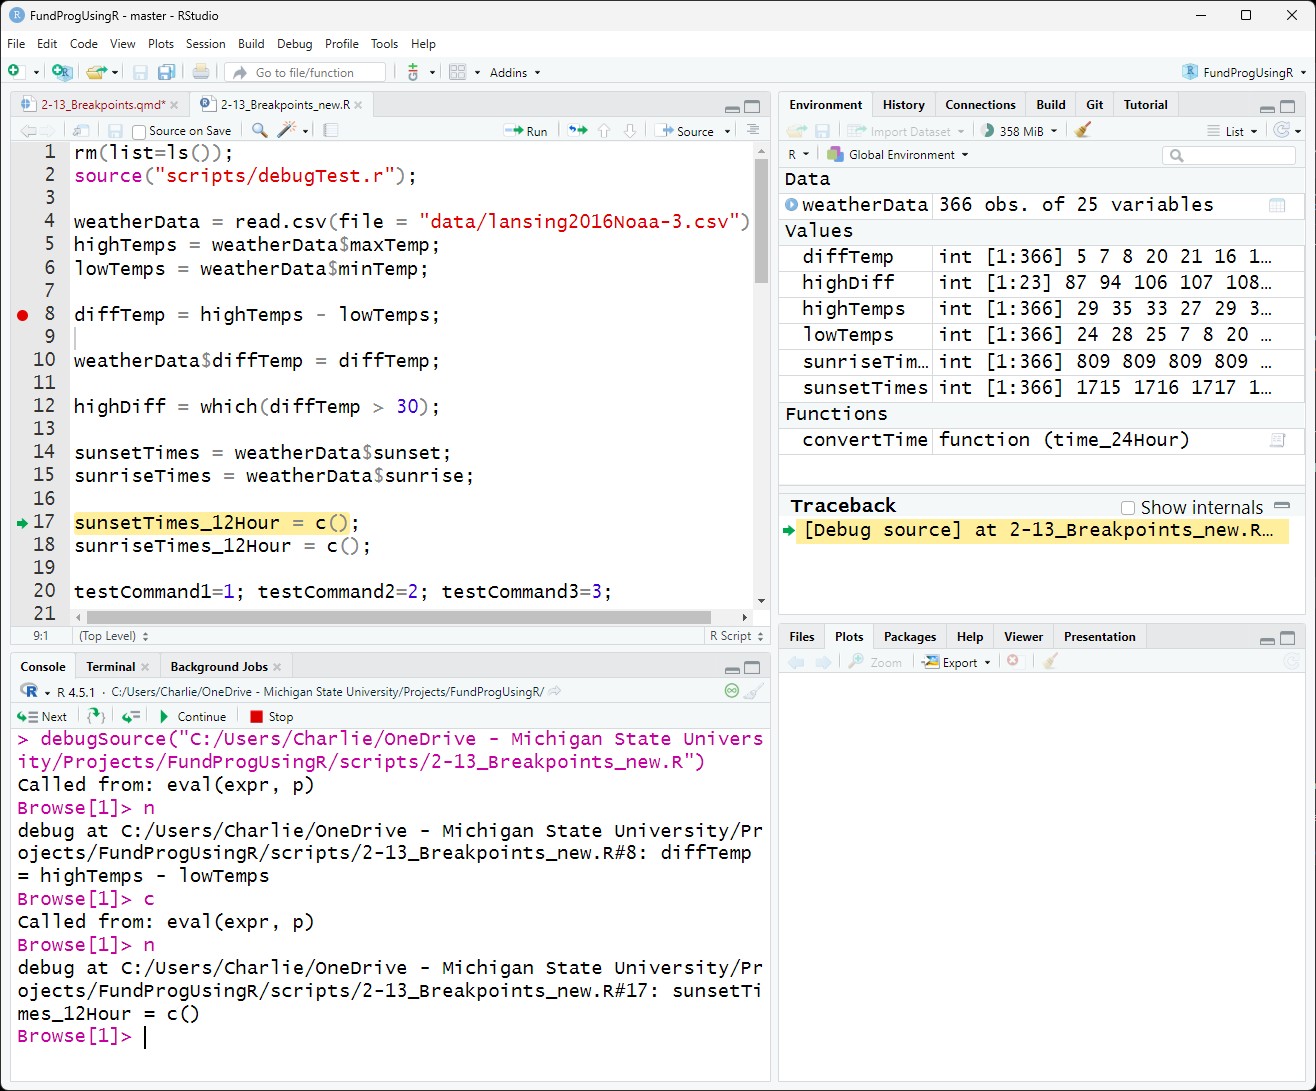
When you Source your code, the script will execute up to, but not including, the line with the breakpoint. Your script is now paused at the line with a breakpoint, and you are in debug mode, which R calls Browse mode (Figure 2).
Note: A breakpoint only works when you Source your script. It will not work if you use Run to execute lines of code.
4.1 Debug Mode
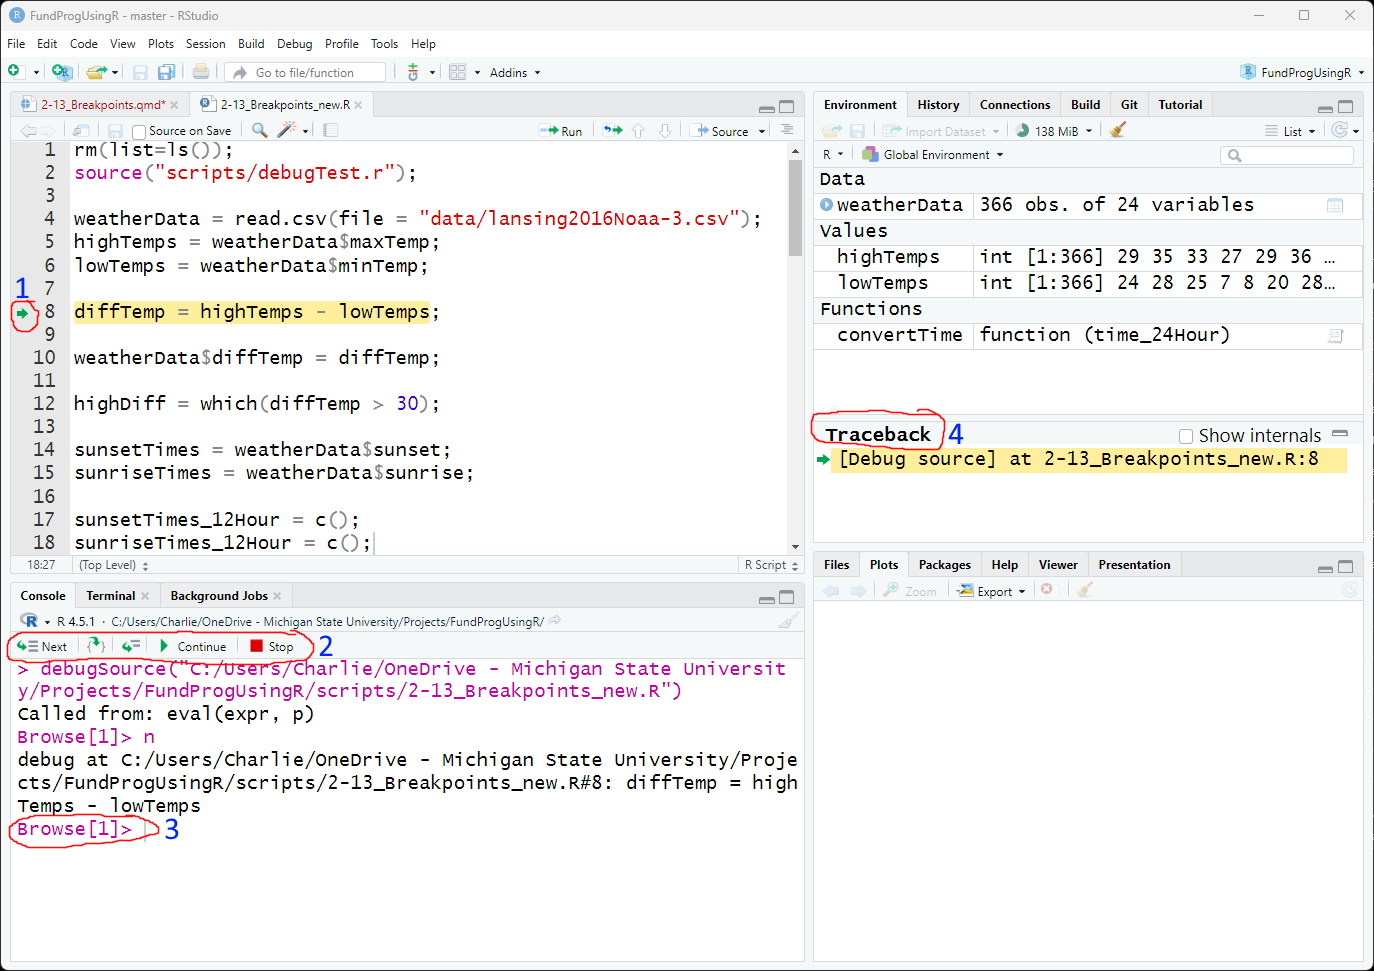
There are 4 things in RStudio that will indicate you are in debug mode:
A green arrow will appear at the code line the script is paused at. The green arrow shows you the line that will be executed next
Debug controls will appear in the Console tab
The Console will indicate it is in browse mode with
Browse[1]>- The number (in this case, 1) is supposed to tell you how many browsers you are inside. This is tough to explain, not meaningful at the point, and it does not even seem like it works. So, don’t worry about it!
A traceback window will appear at the bottom of the Environment tab
- traceback is a more advanced debugging tool that we will not get into in this lesson
5 Using the Browse in breakpoint
In this lesson I will put breakpoint instructions in comments like this so you can follow along:
## In the lesson script:
## Place a breakpoint at line 8 in the lesson’s script and click Source
8 diffTemp = highTemps - lowTemps;In Figure 2, the script is currently paused at line 8, this means all commands in lines 1-7 have been executed. In the Environment you can see weatherData, highTemps, and lowTemps, which were added between lines 1-7.
weatherData 366 obs. of 24 variables
highTemps int [1:366] 29 35 33 27 29...
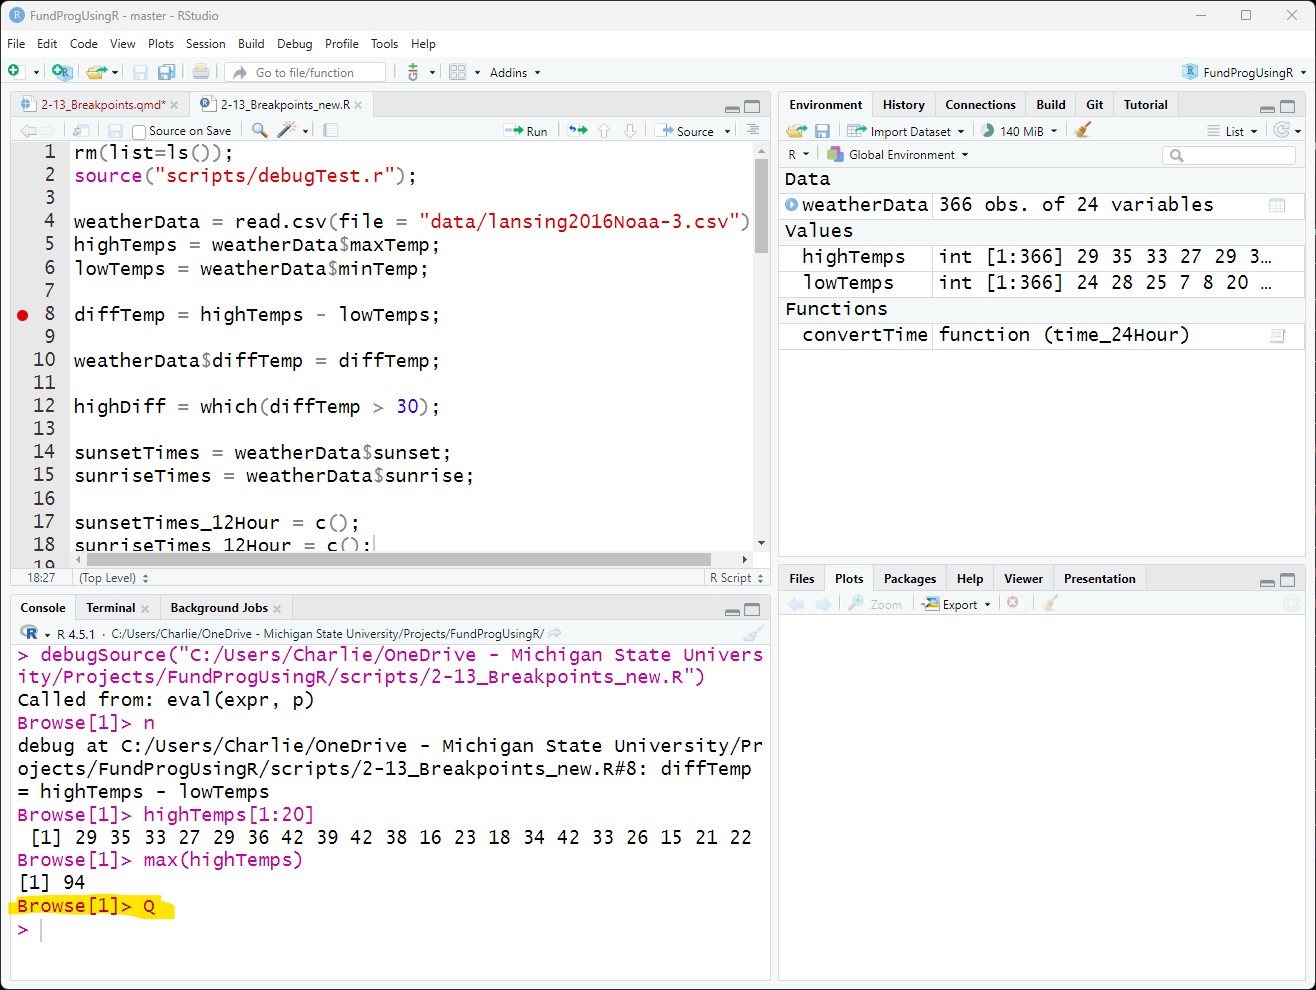
lowTemps int [1:366] 24 28 25 7 8 20...When in debug mode, you can enter commands in the Console. With these commands you can do things like view values in or execute functions on a vector:
Browse[1]> highTemps[1:20]
[1] 29 35 33 27 29 36 42 39 42 38 16 23 18 34 42 33 26 15 21 22
Browse[1]> max(highTemps)
[1] 94
Or, you can create a new variable and add it to the Environment:
Browse[1]> highTemp_C = (5/9)*(highTemps-32)
Browse[1]>
highTemp_C num [1:366] -1.667 1.667 0.556 -2.778...6 Moving through code in debug (browse) mode
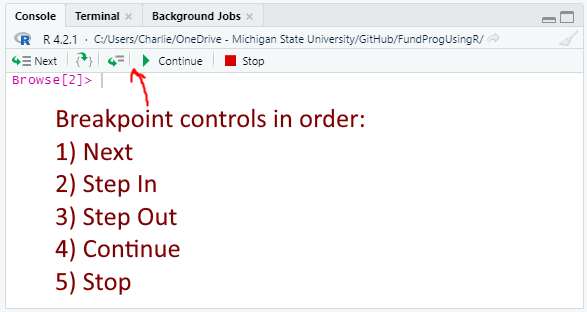
When your script arrives at a breakpoint (Figure 2) , five buttons to control the flow of your script appear in the Console tab:
1) Next: executes the command at the green arrow (in other debuggers, this is often called Step Over)
2) Step In: moves into a function
3) Step Out: completes a for loop or function
4) Continue: unpauses the execution of the script (like hitting the Play button when a video is paused)
5) Stop: quits the script (no more code is executed)
When in debug mode you should only use the buttons to control the flow of your script. Clicking Source while in debug mode will cause problems with your script. Extension: Clicking Source in debug mode (read next section on Stop first).
6.1 Stop
Clicking Stop will take R out of debug mode and end the execution of the script. In other words, no more commands in the script will be executed and all the components of debug mode (Figure 2) will go away.
When you click Stop, Q is put in the Console. Q is the command to quit debug mode. You could directly type Q instead of clicking Stop.
6.2 Continue to next Breakpoint
## In the lesson script:
## Add a second breakpoint on line 17 (so, now we have breakpoints at lines 8 and 17) and click Source
17 sunsetTimes_12Hour = c();The script will pause at the first breakpoint (line 8). If you click Continue, the script will unpause and continue executing the script until the next breakpoint is reached on line 17 and pause there. Between the first and second pause, lines 8-16 are executed and the results of these commands are in the Environment.
In Console, the Continue command is c.
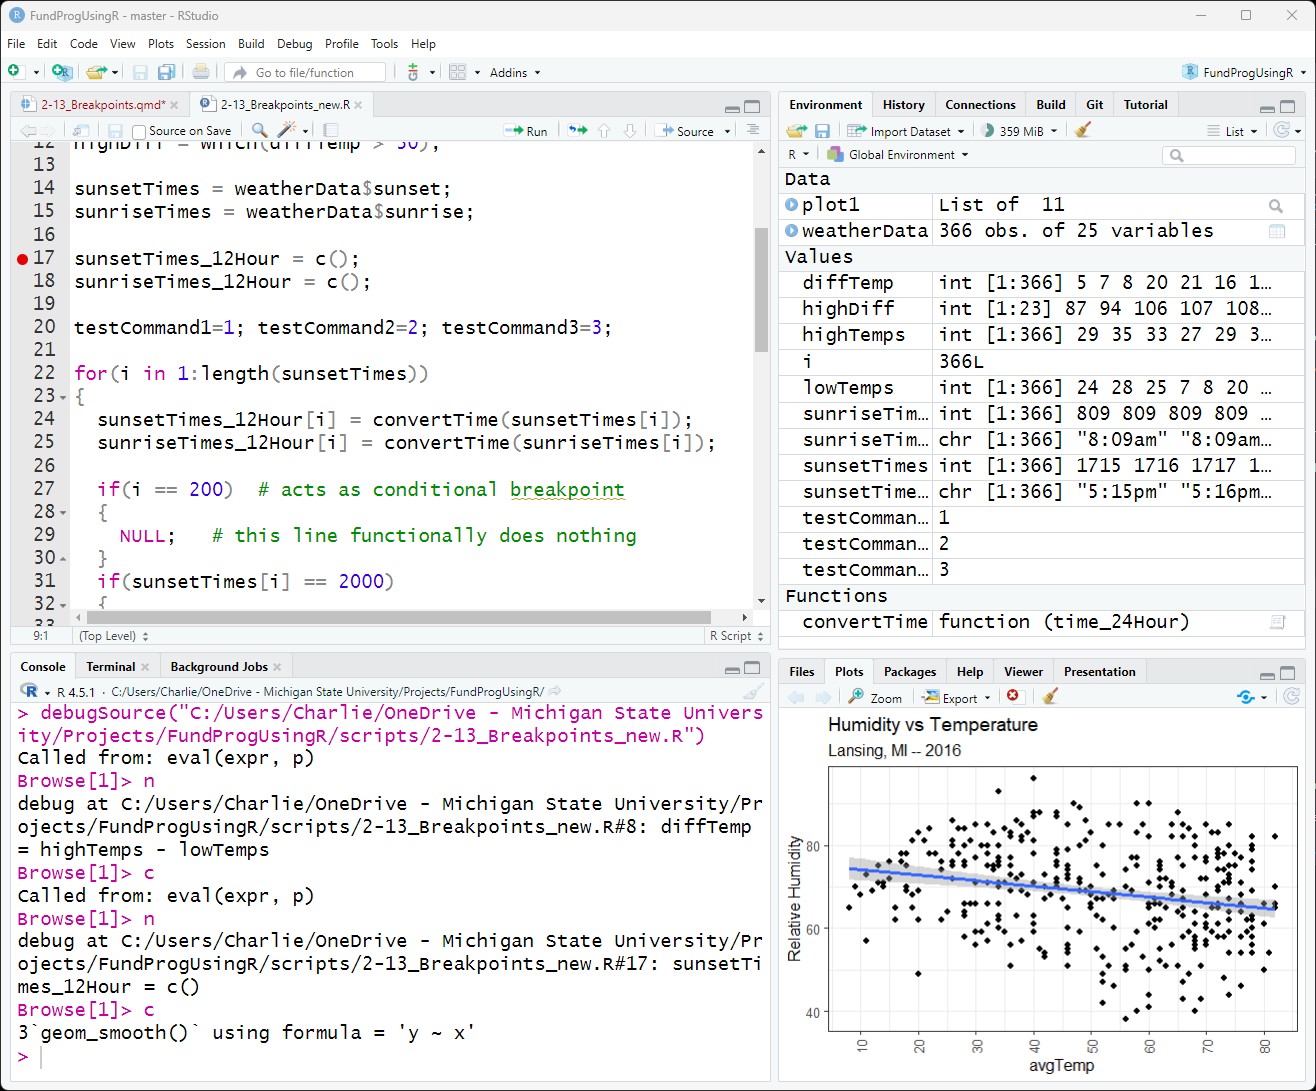
6.3 Continue to end of script
After line 17 there are no more breakpoints, so if you click Continue again, the rest of the script will be executed and you will be taken out of debug mode.
6.4 breakpoint inside for loop
## In lesson script:
## Remove the breakpoints at lines 8 and 17
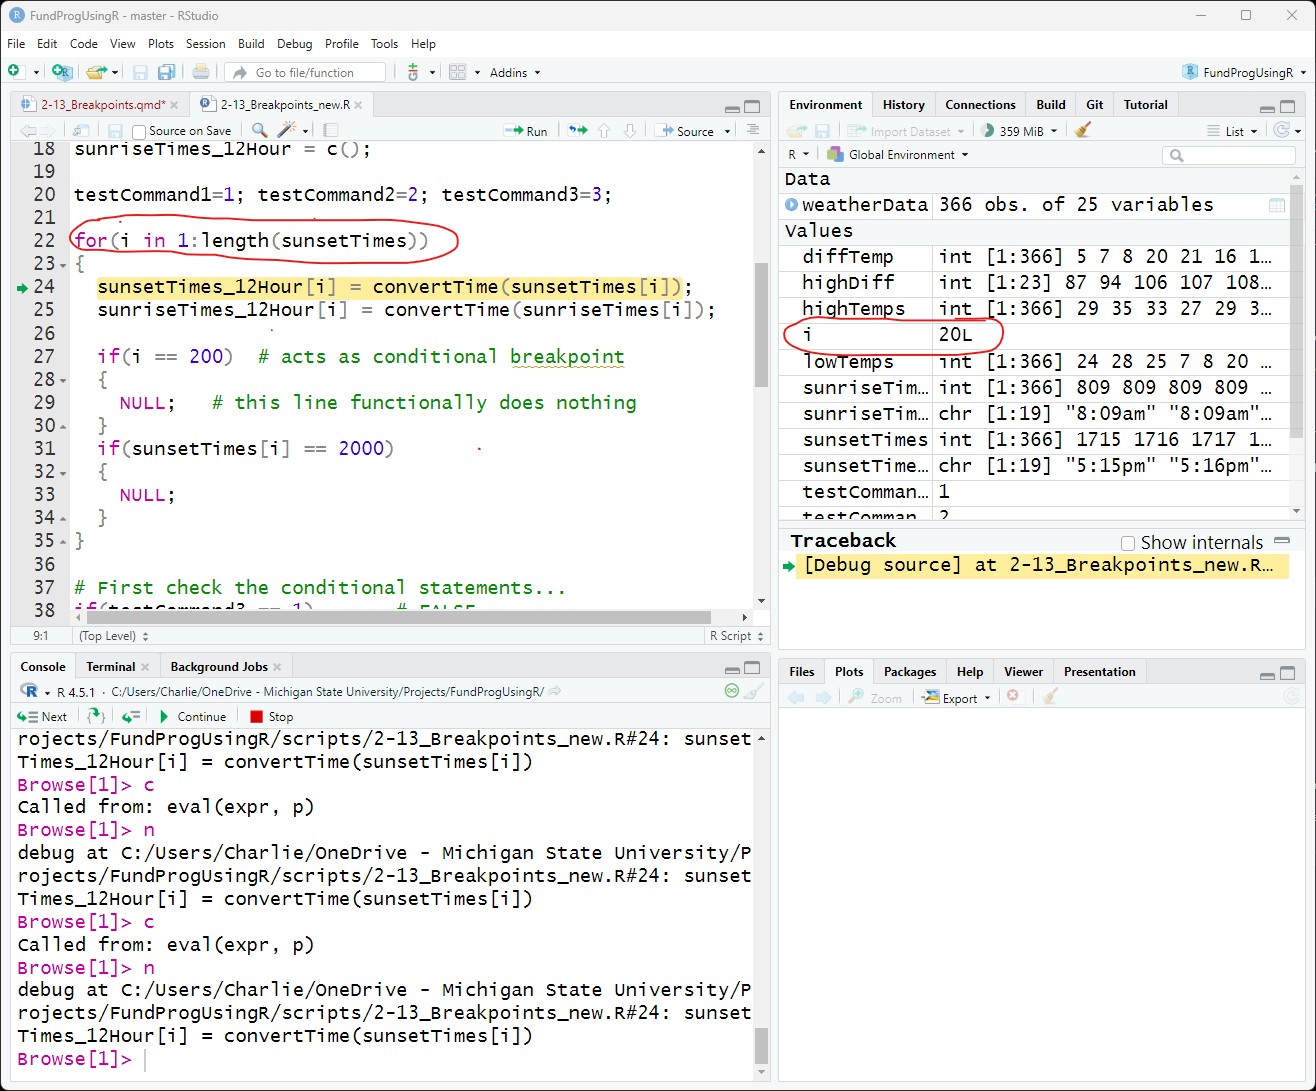
## Add a breakpoint at line 24 (inside the for loop)
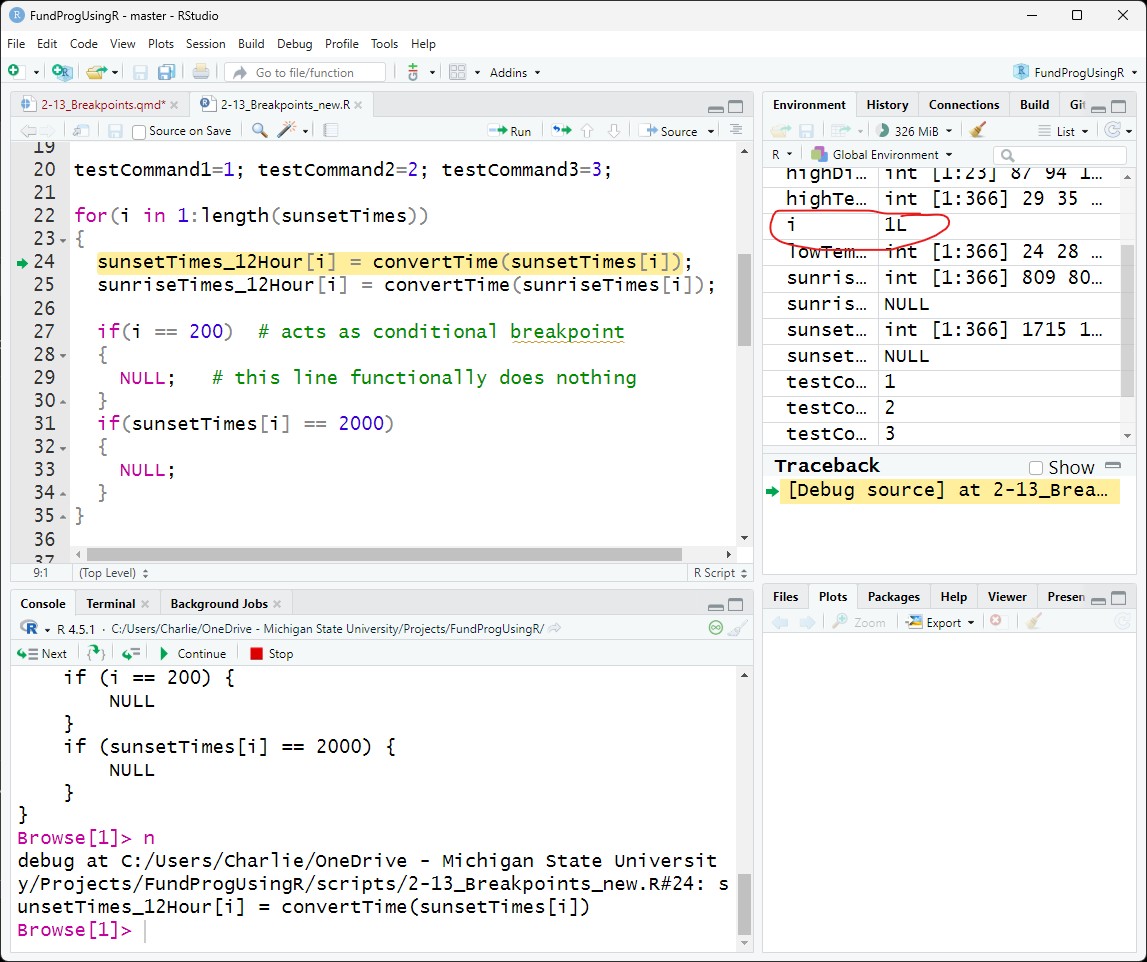
24 sunsetTimes_12Hour[i] = convertTime(sunsetTimes[i]);If you put a breakpoint inside a for loop then Continue will stop at the breakpoint every cycle of the for loop. In Figure 7 I clicked Continue 20 time and the for loop has cycled 20 times (and i = 20)
6.5 Next
## In lesson script:
## Remove breakpoint on line 24
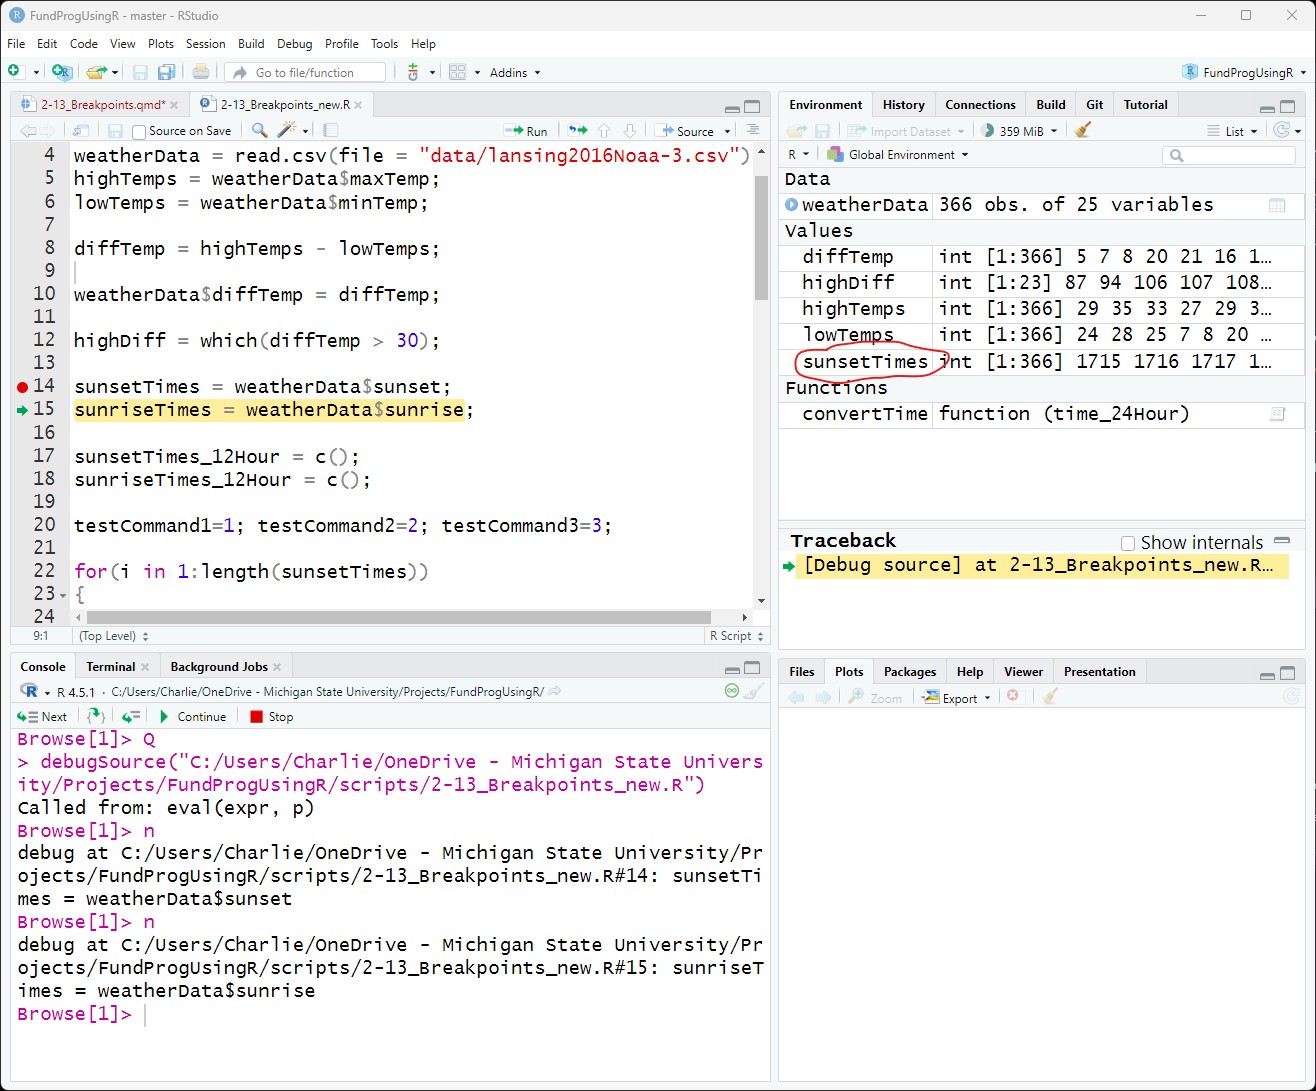
## Add a breakpoint on line 14
14 sunsetTimes = weatherData$sunset;If we Source the script, the code up until line 13 will execute and line 14 will have a green arrow in the gutter.
We can now execute one command at a time using Next.
Clicking Next executes the command on line 14 and moves the green arrow to the next command on line 15.
So, sunsetTimes is created and put in the Environment and line 15, which creates sunriseTimes, is highlighted with the green arrow..
6.6 Multiple Commands on one line
## In lesson script:
## Click Next until you get to line 20
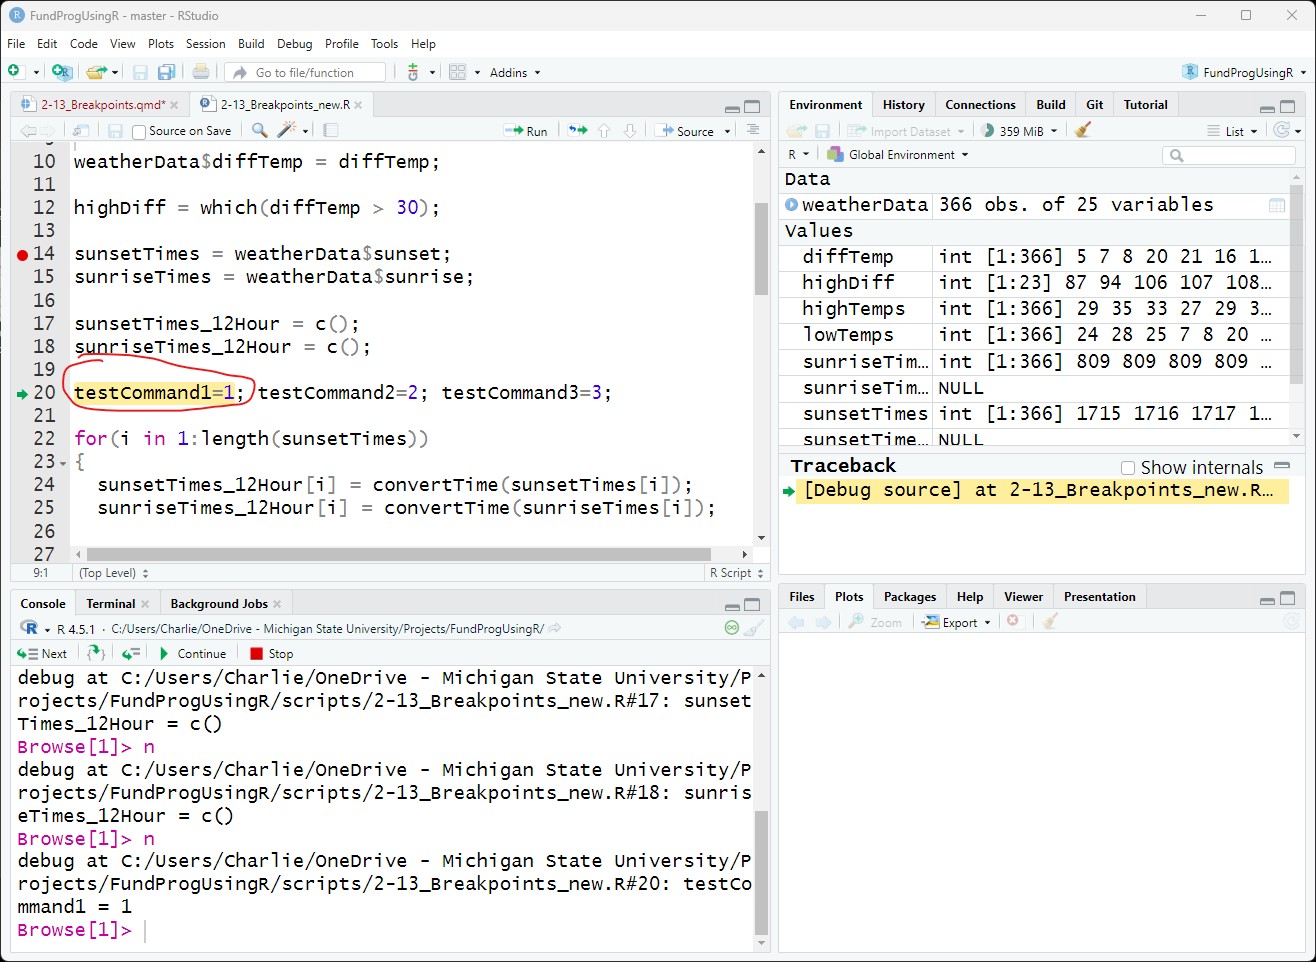
20 testCommand1=1; testCommand2=2; testCommand3=3;Next does not execute lines, Next executes commands. Lines 17 and 18 have one command each but line 20 has 3 commands. If there are multiple commands on one line then Next will execute them one at a time and the debugger will highlight the current command.
7 Debugging in a for loop
## In lesson script:
## Click Next until you get to line 22
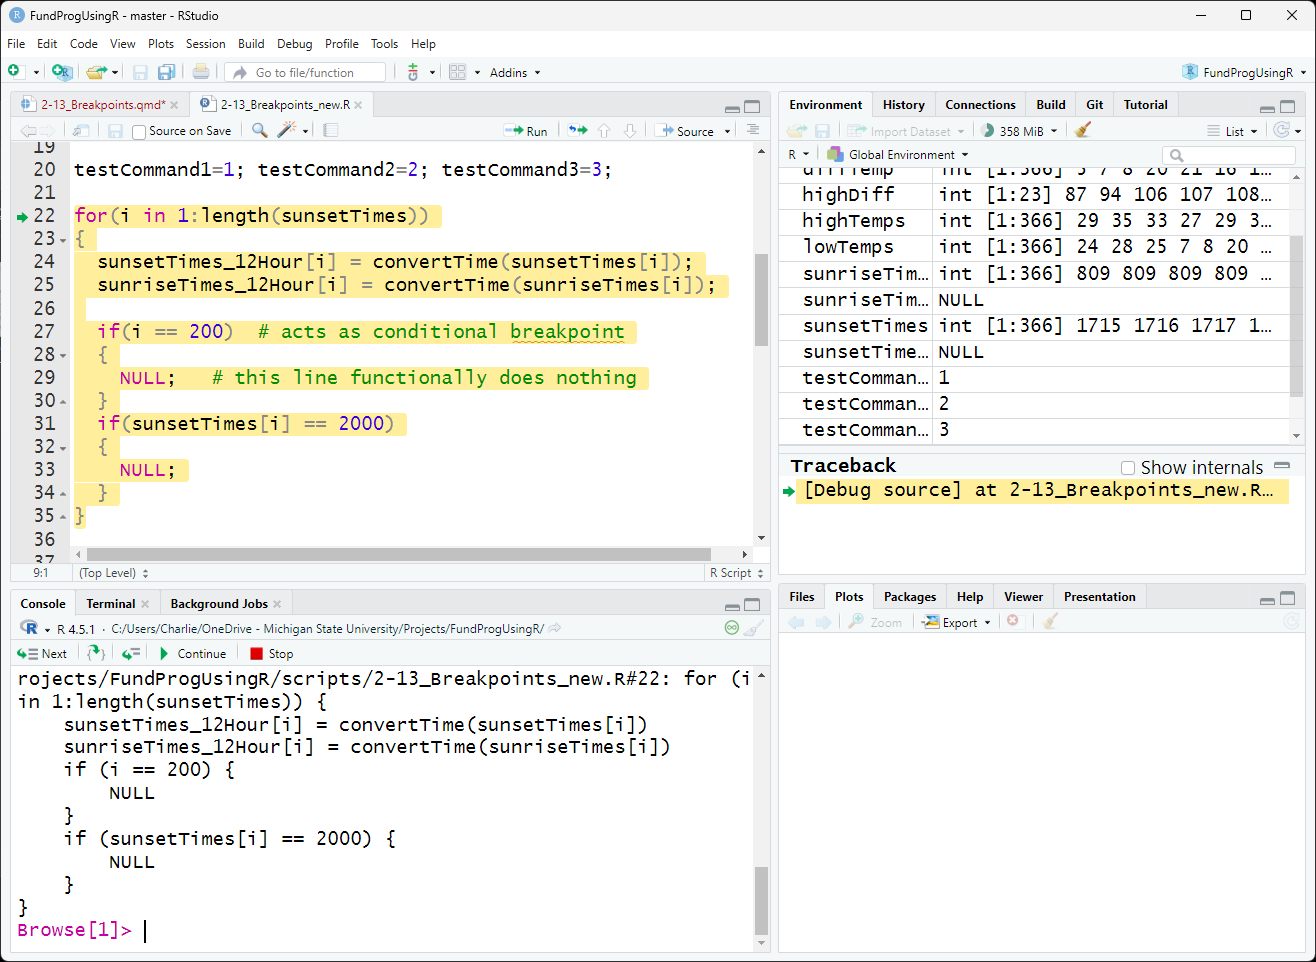
22 for(i in 1:length(sunsetTimes))When the green arrow gets to a for loop, RStudio will highlight the whole for loop:
Clicking Next executes the initialization command for the for loop:
for(i in 1:length(sunsetTimes))In this initialization command:
the variable i is set to 1
a rule is given for how i changes each time the for loop cycles (i.e., i increases by 1)
the cycles end when i is equal to the length of sunsetTime
The initialization command of a for loop executes once whereas everything inside the for loop executes once per cycle of the for loop.
After the initialization command is executed, Next will move to the commands inside the for loop codeblock:
If you keep clicking Next and debug mode will go through each command in the for loop for each cycle of the for loop
7.1 Step Out of the for loop
If you are inside a for loop and want to finish executing the whole for loop (i.e., complete every cycle of the loop), you can click Step Out. This will execute the rest of the for loop and put the control on the next command as long as you have no breakpoints in the for loop.
Note: If you have a breakpoint inside the for loop then Step Out will just execute to the breakpoint – similar to Continue (Figure 5).
7.2 Conditional breakpoints
## In lesson script:
## Click Stop
## Remove all previous breakpoints
## Add breakpoint on line 29 and Source script
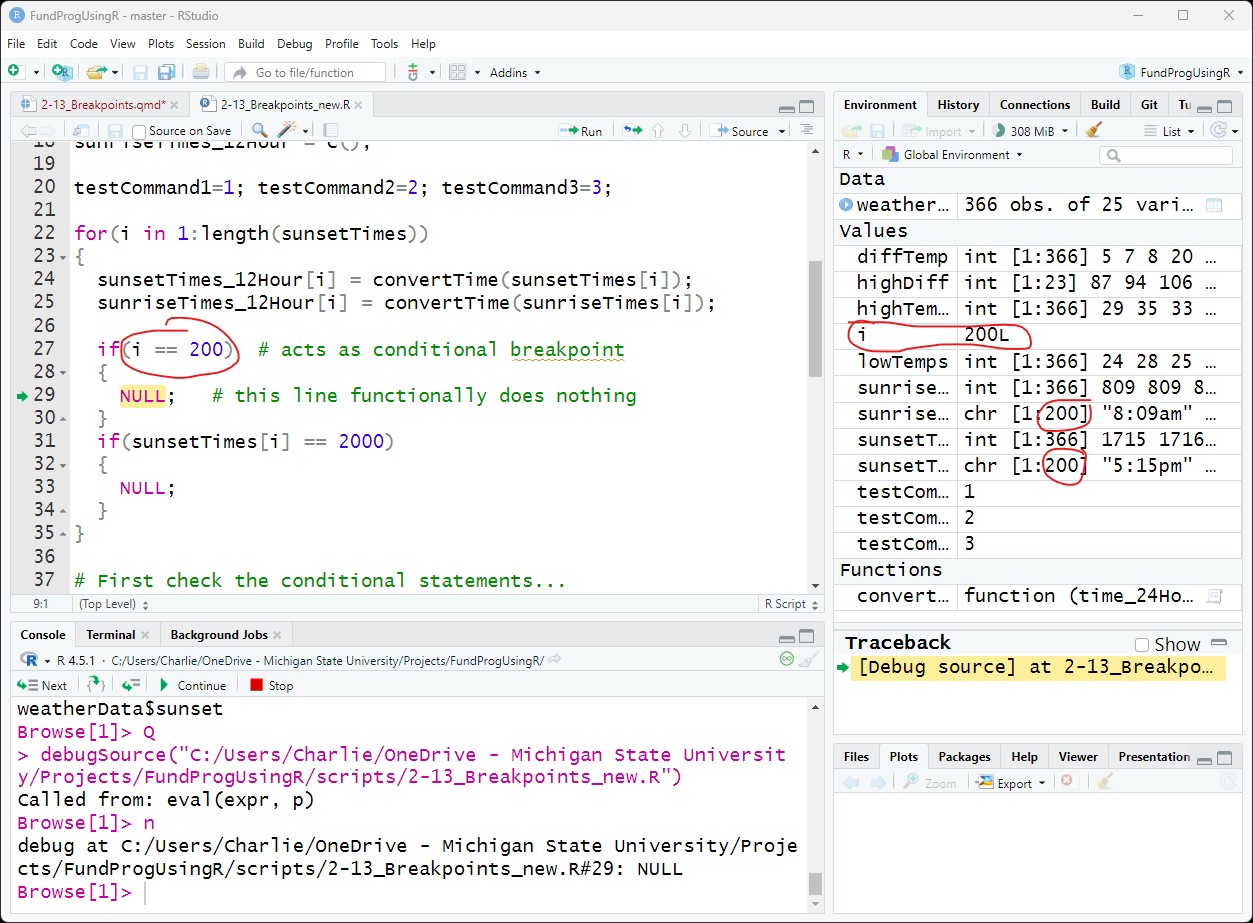
27  if(i == 200)  # acts as conditional breakpoint
28  {
29    NULL;   # this line functionally does nothing
30  }
A for loop can easily run thousands or millions of times and you often only want a breakpoint on a specific cycle of the for loop. In most programming language, you can attach a condition to the breakpoint so that the breakpoint only activates when specified.
In R, you need to manually code this condition. You can pause at a specific cycle of the for loop using an if statement:
if(i == 200)    # acts as conditional breakpoint
{
  NULL;  # this line functionally does nothing
}
The breakpoint needs to be put inside the codeblock attached to the if statement. Inside the codeblock is a NULL command – meaning it does nothing. NULL is only there to provide a space for the breakpoint.
With the breakpoint on line 29, the script will pause on the 200th cycle of the for loop:
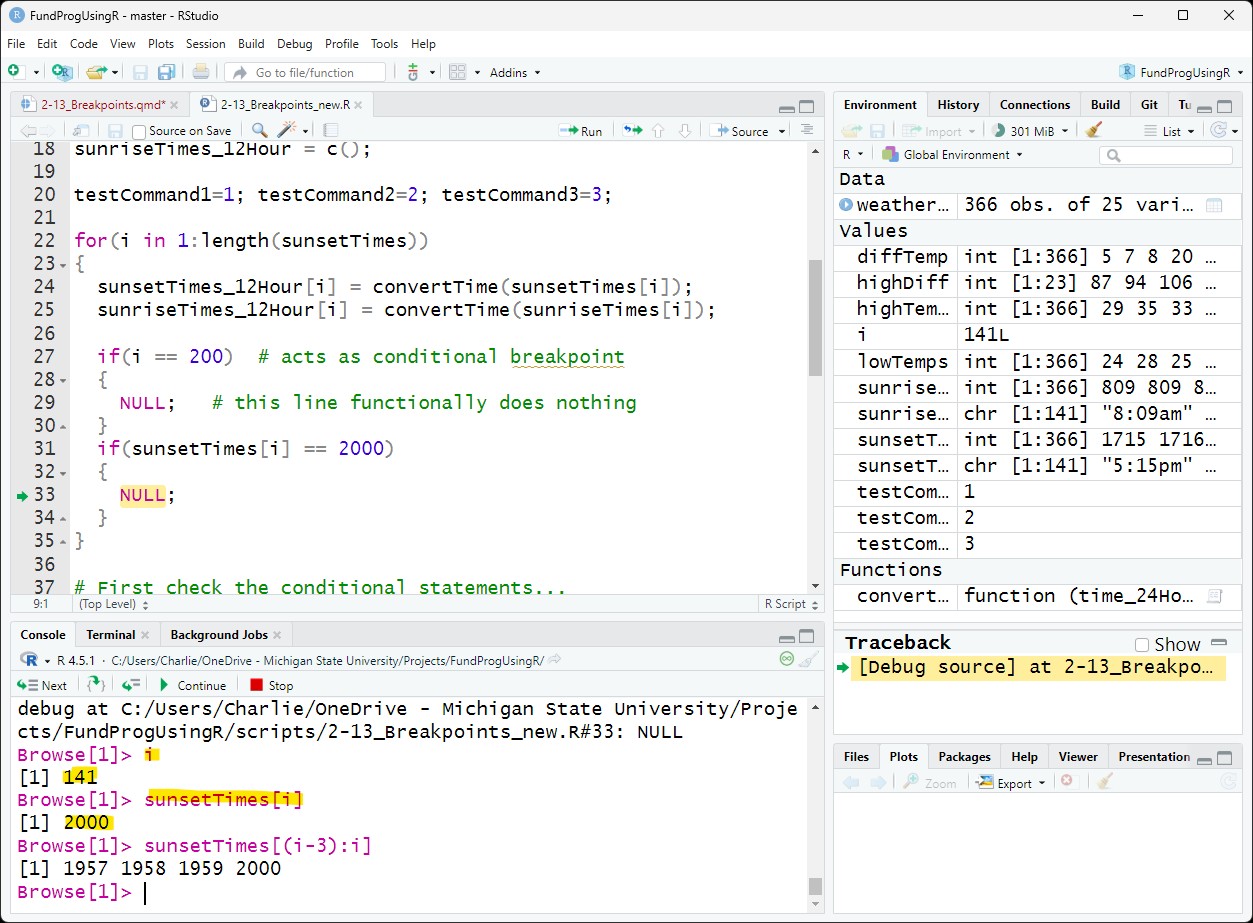
Or, if you put a a breakpoint at line 33, you can conditionally break on a value being used in the for loop:
if(sunsetTimes[i] == 2000)
{
  NULL;
}
The script will pause on the 141st cycle of the for loop, which represents the first day that sunset is at exactly 8:00pm (2000 hours)
8 If-else statements
## In lesson script:
## Remove all previous breakpoints
## Add a breakpoint on line 38
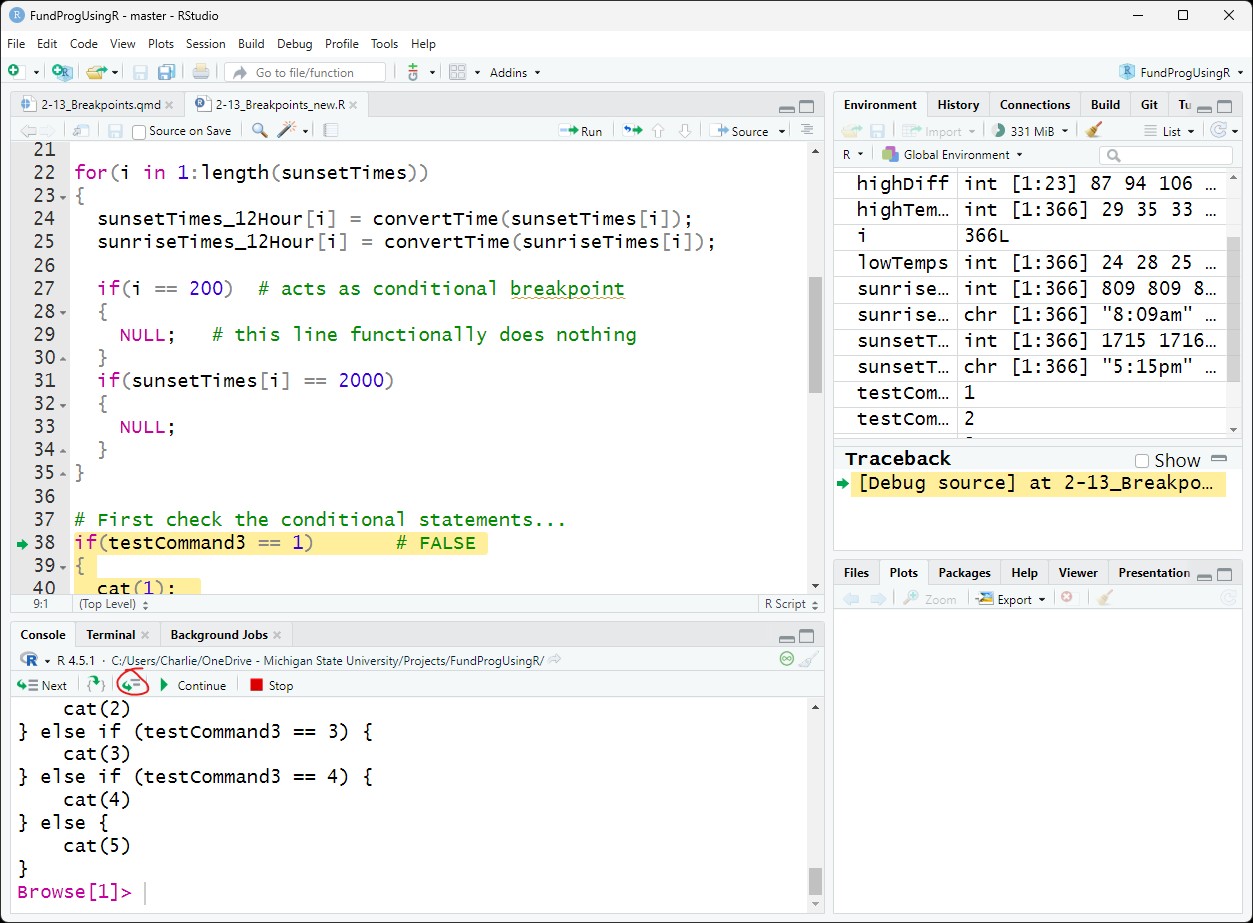
38 if(testCommand3 == 1) # FALSESimilar to the initialization of for loops, the code inside the parentheses of if-else statements is a command. The command, which is a conditional statements, outputs a Boolean (TRUE/FALSE) value that is used to determined if the codeblock gets executed.
When you set a breakpoint at the if() line, the whole if-else is highlighted in RStudio when the code is stopped at the line.
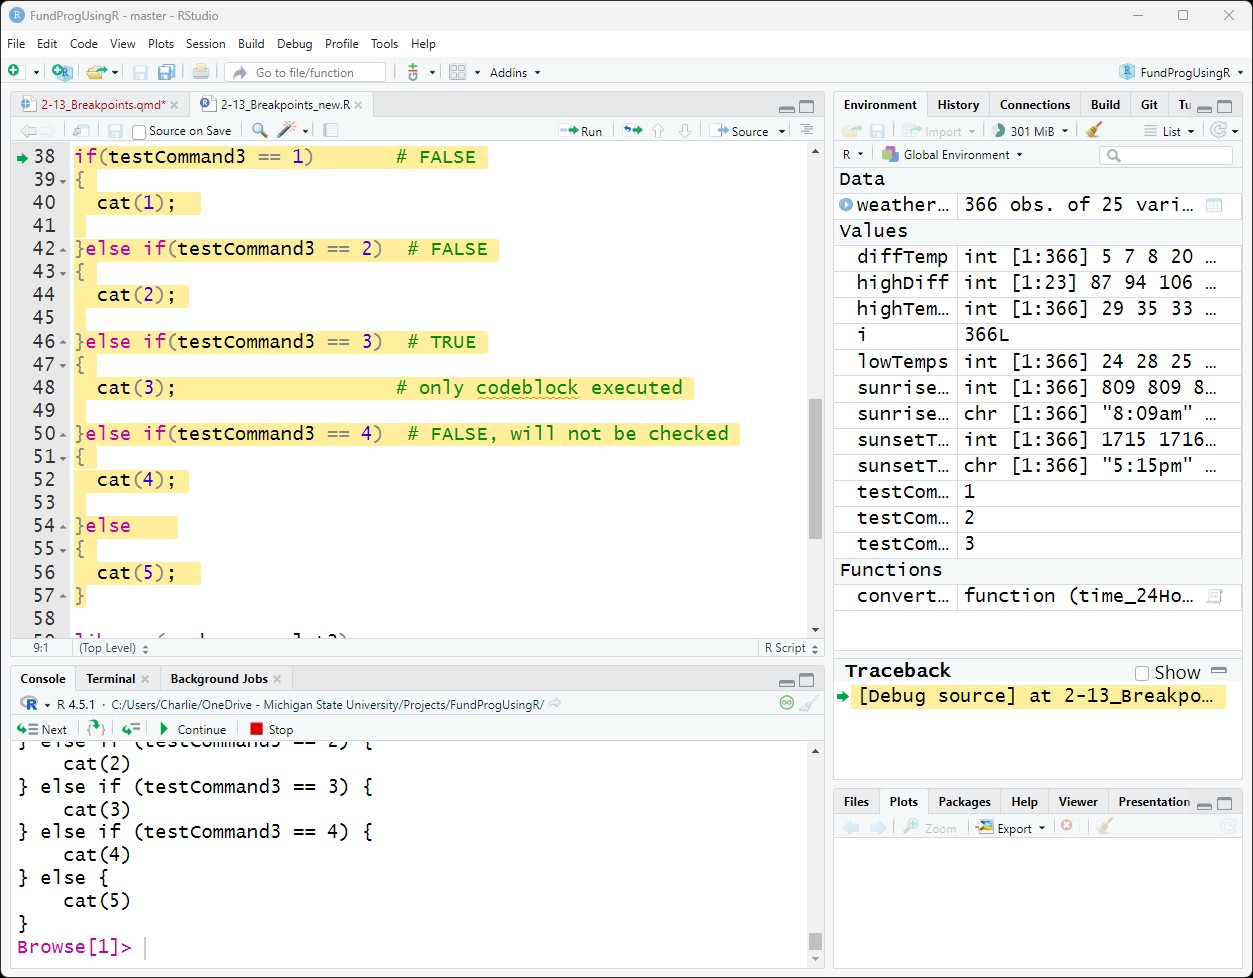
As you click Next, the control (green arrow) will either:
move to the next conditional statement (if the current conditional statement is FALSE)
move inside the codeblock (if the current conditional statement is TRUE)
The following lines are not executed in an if-else structure and will be skipped over in debug mode:
codeblocks attached to FALSE conditional statements
else statements that were preceded by a TRUE conditional statement
- the codeblock attached to these else statements will also not be executed
9 Debugging within functions (Step In)
Inside the for loop on lines 24 and 25, we call convertTime() twice. convertTime() is a function inside debugTest.R. If you click Next while on line 24, then the whole line is executed, along with the convertTime function, and control will go to the next line.
You can debug inside the convertTime function by clicking Step-In while on the lines 24 or 25 (the lines with the function) – this will move control to the function and the whole function will be highlighted:
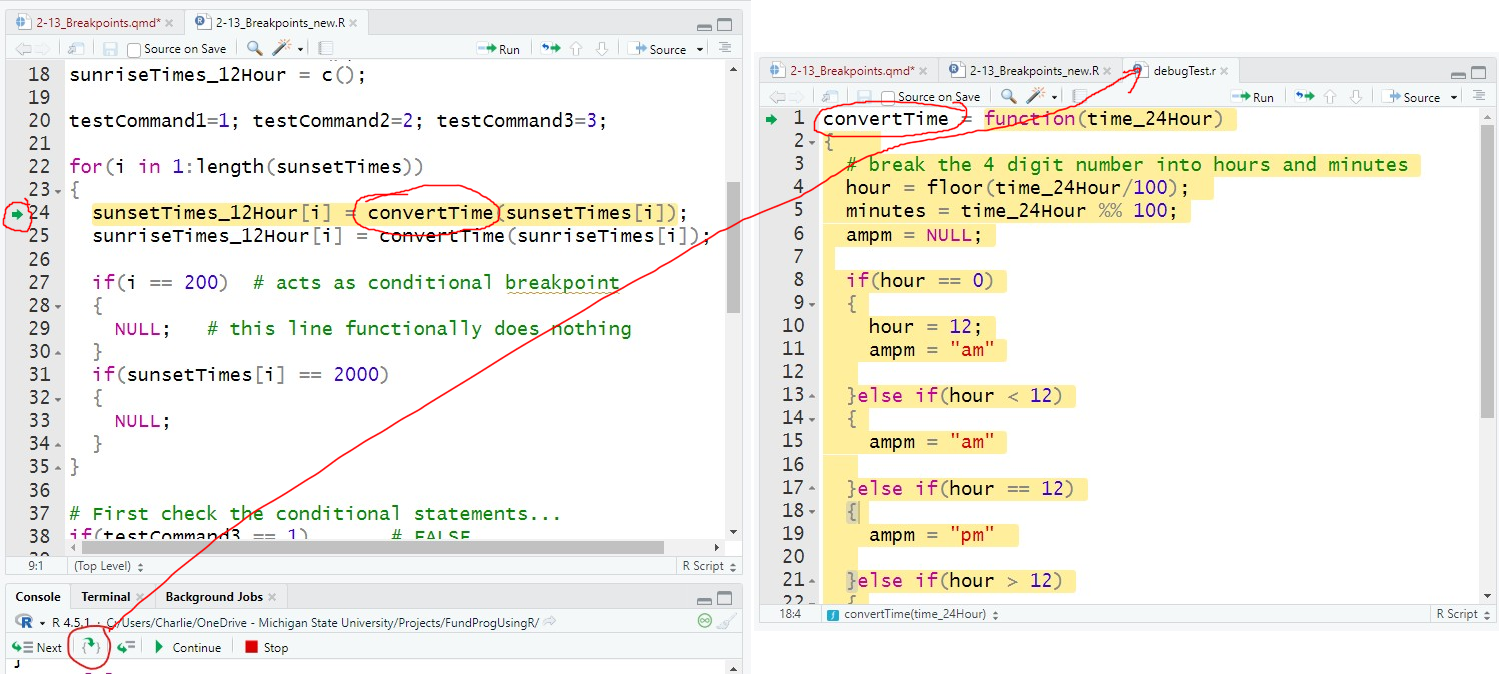
Step-in works whether the function is inside the same script or in another script. However, Step-in will not work if the function is inside a package – for packages that we need to use trace() (next lesson).
9.1 Executing command within the function
Once inside the function you can use the debug buttons like before. Next will execute one command at a time inside the function. Step Out will complete the whole function and return to the next command in the main script.
10 Other ways to add breakpoints
This lesson only goes through the fundamentals of breakpoints and debugging that apply to just about any programming language. The methods in this lesson work if you are debugging the script you are executing, however, the methods will not work for debugging script files outside of your main script (the one you Source) or functions within packages. Other strategies are needed to add breakpoints to these scripts, which we will go over in the next lesson.
11 Application
A) In Comments at the end of the script answer the following questions:
Why might it be a bad idea to put breakpoint without a condition inside a for loop?
What happens when you try to put a breakpoint on a line with only comments? (try it)
What happens if you put a breakpoint at line 48 and click Source? How about line 44? Why is there a difference?
What happens if you put a breakpoint in the middle of the ggplot() call?
B) Set up a conditional breakpoint within the for loop that pauses the script every 30th cycle.
- A good way to to do this involves using modulus division
C) Set up a conditional breakpoint within a for loop to pause the code when windSpeed is between 35 and 40mph.
Save the script as app2-13.r in your scripts folder and email your Project Folder to Charlie Belinsky at belinsky@msu.edu.
Instructions for zipping the Project Folder are here.
If you have any questions regarding this application, feel free to email them to Charlie Belinsky at belinsky@msu.edu.
11.1 Questions to answer
Answer the following in comments inside your application script:
What was your level of comfort with the lesson/application?
What areas of the lesson/application confused or still confuses you?
What are some things you would like to know more about that is related to, but not covered in, this lesson?
11.2 End-of-class survey
Please take this short (less than 5 minutes) survey regarding this class.
12 Extension: Clicking Source in debug mode
Sourcing a script when it is in debug mode is never a good idea. When you click Source while in debug mode, you are creating a new instance of your script with all the breakpoints attached. What this effectively means is that you are in multiple debug modes for the same script. When you want to quit debug mode, you have to quit for each instance. Something like this:
Browse[1]> Q
Browse[1]> Q
Browse[1]> Q
Browse[1]> Q
Browse[1]> Q
Browse[1]> Q
Browse[1]> Q
Browse[1]> Q
Browse[1]> Q
Browse[1]> Q
> 13 Extension: Modifying breakpoints in debug mode
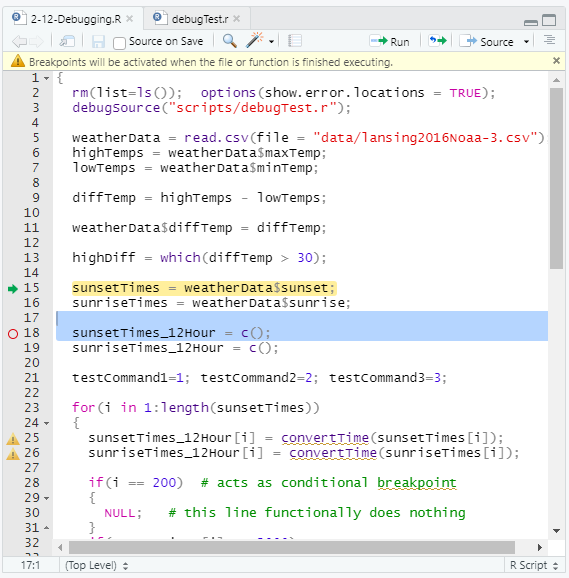
Breakpoints added in debug mode will not work until the next time the script is Sourced. You will see an outlined red dot and a message about how breakpoints will not be active.
If you remove a breakpoint in debug mode, the red dot will disappear but the breakpoint remains in effect until you exit debug mode.
14 Extension: Removing all breakpoints
Sometimes breakpoints will not go away even after you click to remove the red dot. This is a bug in RStudio. To fix this you can tell RStudio to remove all breakpoints Debug -> Clear All Breakpoints…
If the problem persists, you will need to close and reopen RStudio.